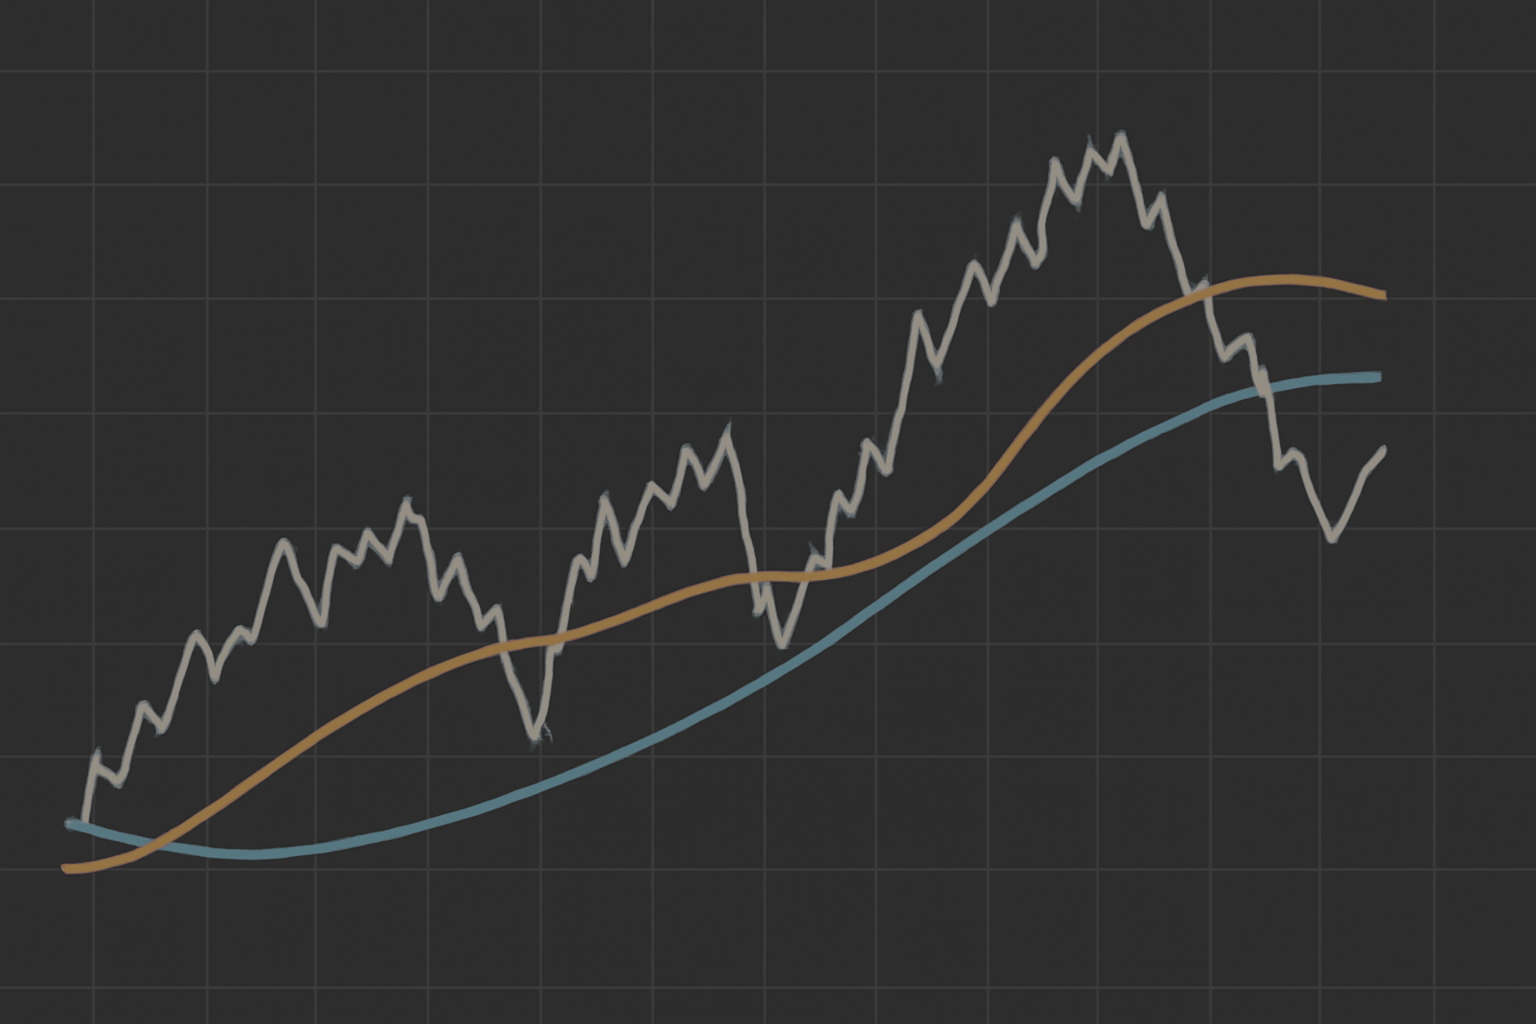
Trading financial markets can seem overwhelming at first, but with the right tools, it becomes much easier to recognize patterns and make informed decisions. One of the most well-known and beginner-friendly strategies in algorithmic trading is the Moving Average Crossover. In this article, we’ll explore how it works, how to use it effectively and how to build this type of strategy in Opportrade.
To understand crossovers, we first need to understand what a moving average actually is.
Price data constantly fluctuates—sometimes wildly—making it tough to grasp the overall direction of a market. Moving averages solve this by smoothing out price action, offering a clearer picture of the trend. These tools are used across different asset classes, from stocks to cryptos to indices.
Here are four common types of moving averages:
Simple Moving Average (SMA): An average of closing prices over a chosen period. It's the easiest to compute.
Exponential Moving Average (EMA): More responsive to recent price changes, giving them greater weight.
Weighted Moving Average (WMA): Assigns varying weights to data points, with recent prices receiving more emphasis.
Triangular Moving Average (TMA): A smoother line formed by averaging an average—this double smoothing filters out even more noise.
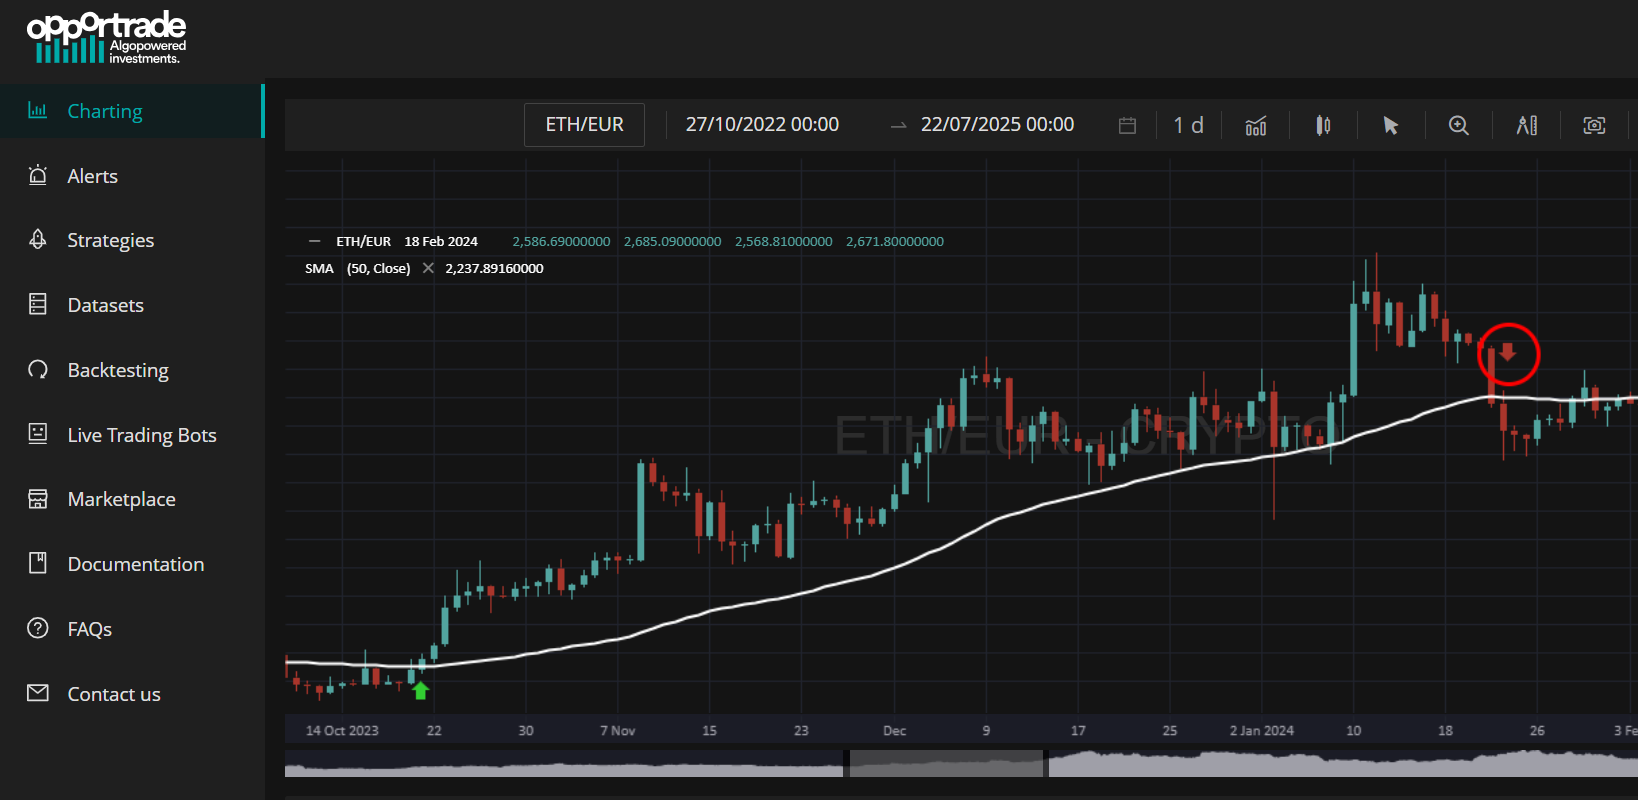
The crossover strategy is built around using two (or more) moving averages. When these lines intersect, they can indicate a change in trend—often interpreted as a signal to enter or exit a position. These moving averages can be of the same or different types.
Let’s look at some variations of the crossover approach:
This basic setup involves tracking when the asset price itself crosses a moving average. For example, traders may plot a 20-day or 50-day moving average.
When the price climbs above the moving average, it’s typically seen as a signal to go long. If it drops below, it may be time to sell or short.
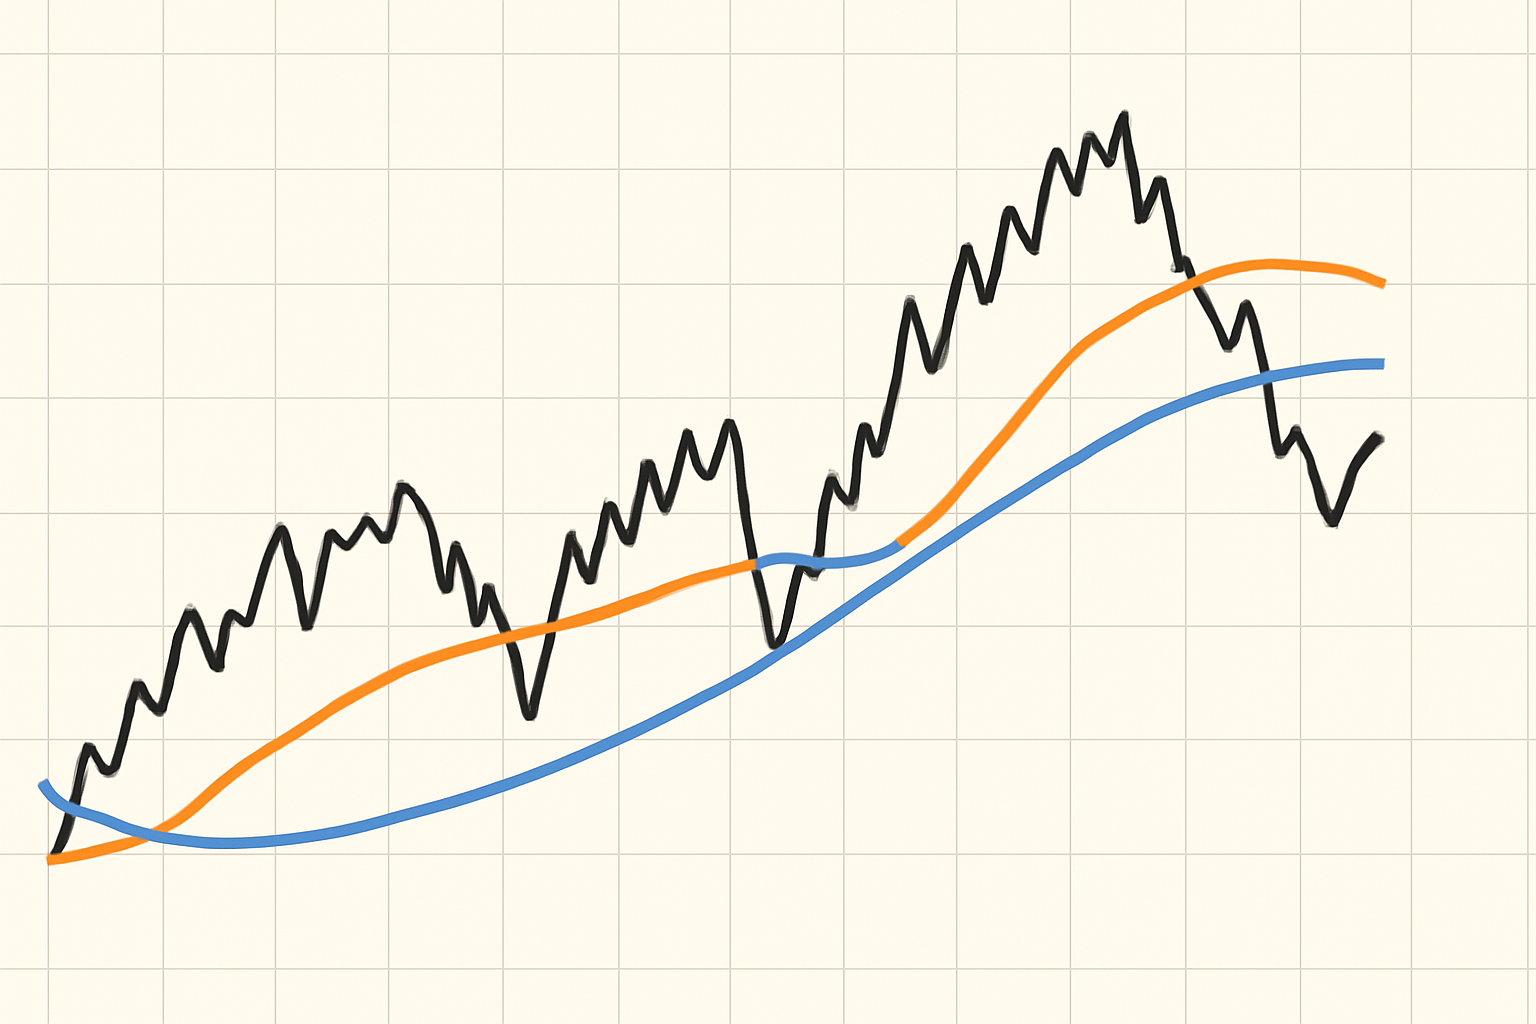
This method uses two moving averages with different timeframes. The goal is to spot trend changes by observing how the two interact.
Say you’re using a 50-day and a 150-day SMA. When the short-term average crosses above the long-term one, it’s a bullish sign—commonly called a Golden Cross. If it drops below, that’s considered a Death Cross, indicating potential weakness or a reversal.
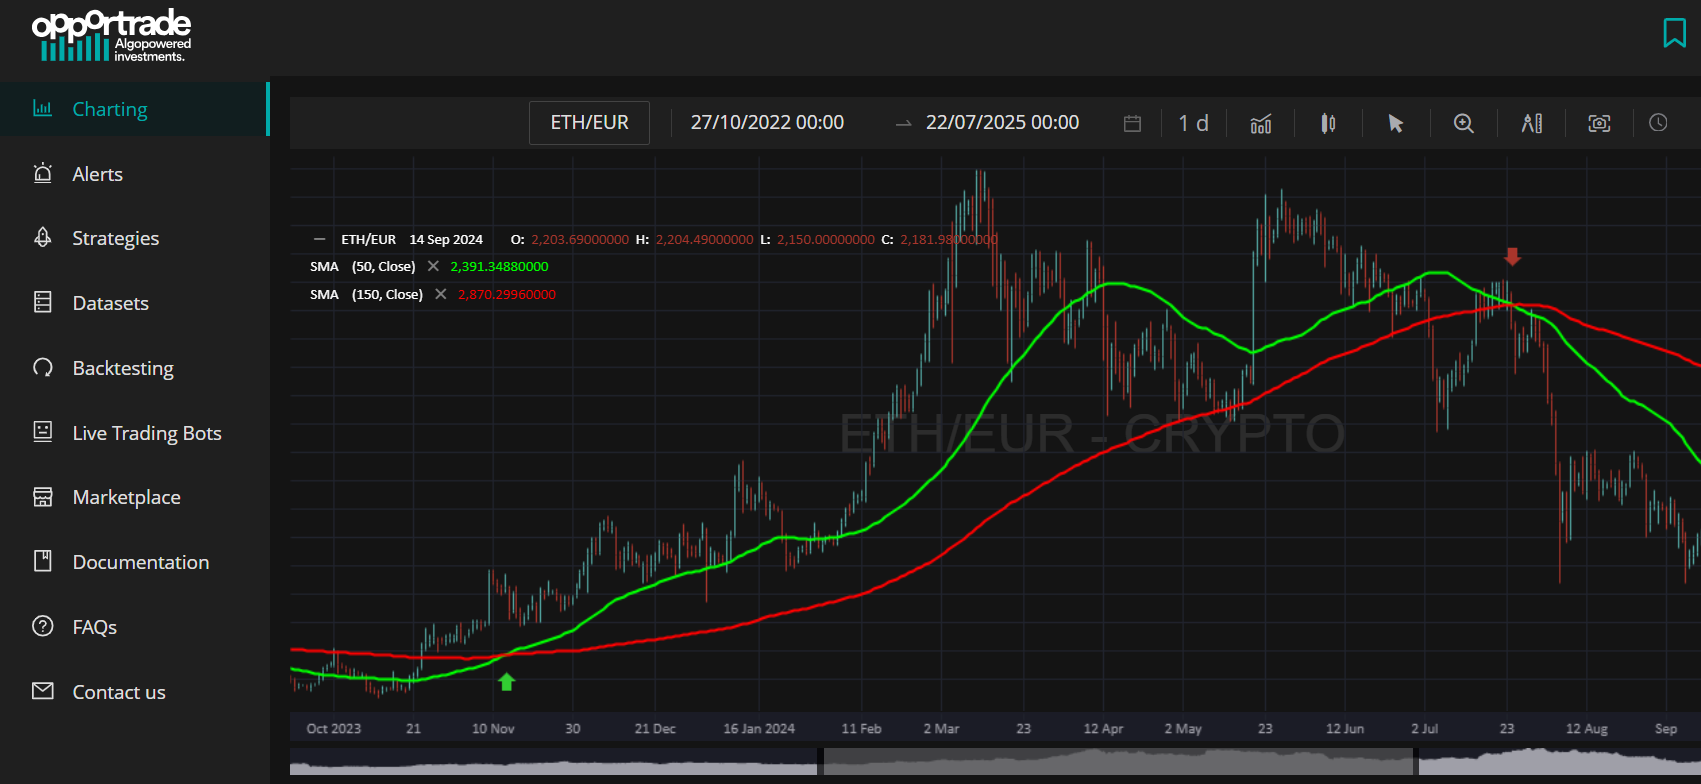
In the following paragraphs, we’ll explain how to build a Moving Average Crossover strategy on Opportrade using our Strategy Creator and writing crossover signals as Tradescript formulas.
However, you can also download this strategy for FREE from our marketplace - no need to build it from scratch!
To build a Moving Average Crossover strategy in Opportrade, simply head over to the Strategy section, open the Signals tab, and add:
a BUY signal when the fast-moving average crosses above the slow-moving average
an EXIT LONG signal when the fast-moving average drops below the slow one
Here’s how to create the BUY signal:
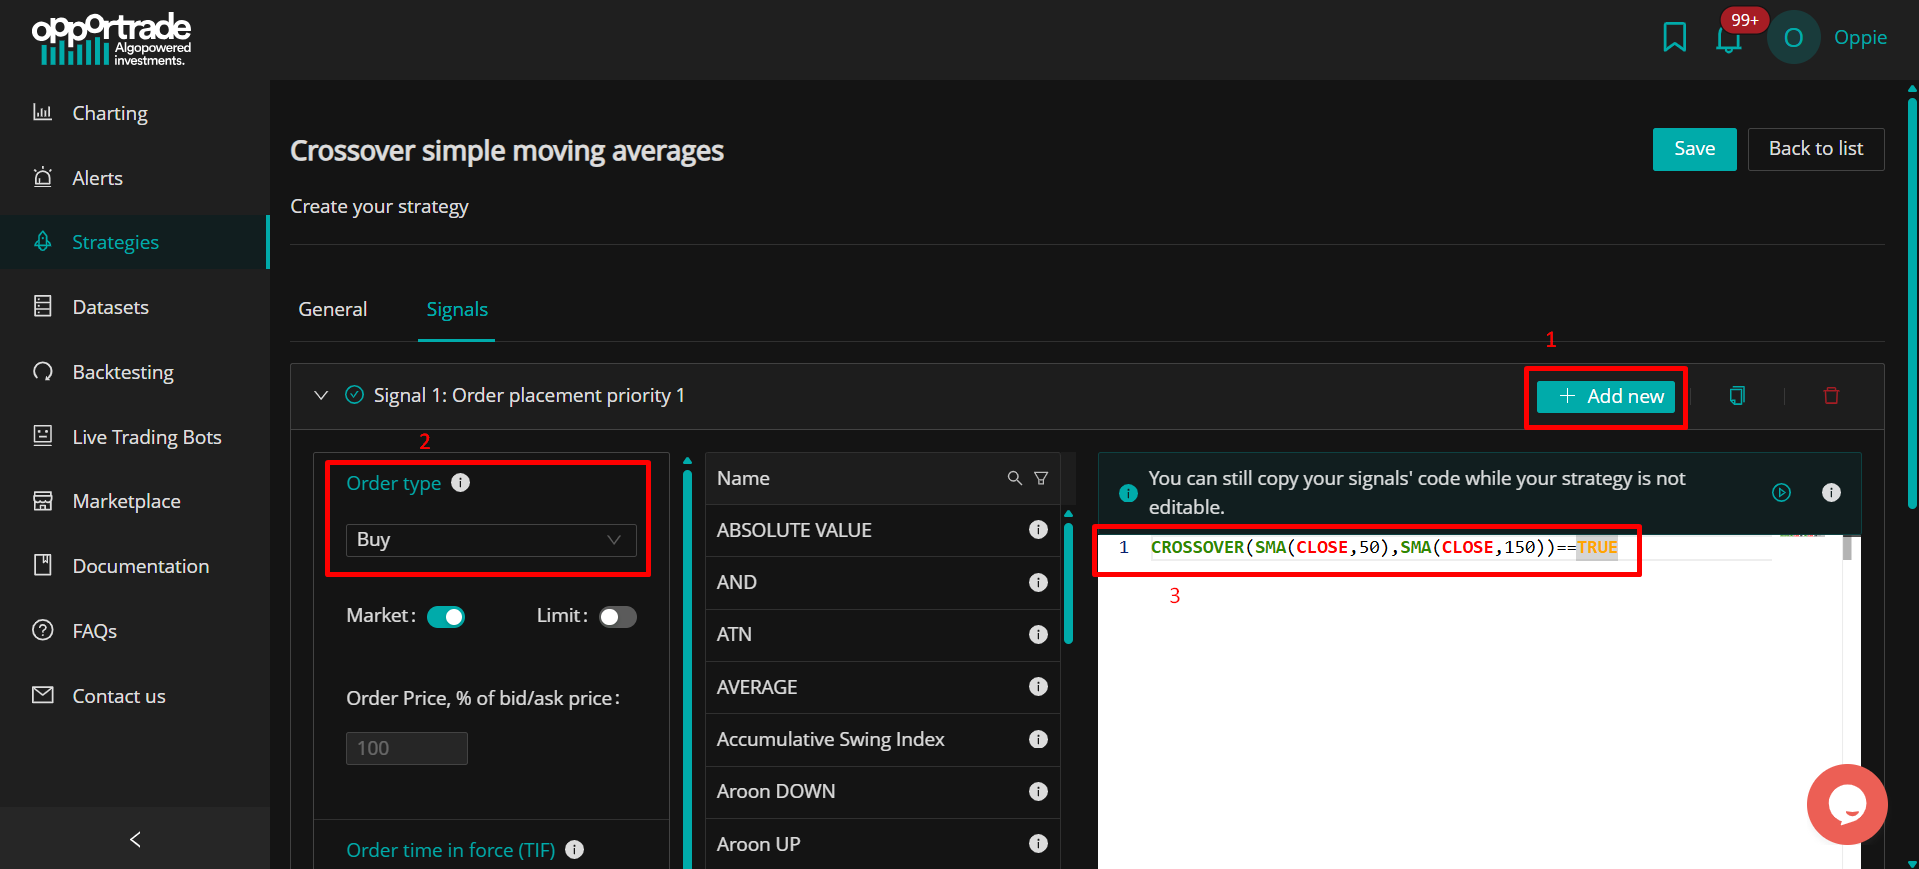
Click the Add new button
In the Order type field, select BUY
In the Tradescript editor, paste the following formula: CROSSOVER(SMA(CLOSE,50),SMA(CLOSE,150))==TRUE
Configure the remaining order parameters and save the signal
This condition will generate a BUY order every time the 50-period simple moving average crosses above the 150-period simple moving average.
Note:
If you'd like to use different types of moving averages or parameters, all you need to do is adjust the formulas inside the CROSSOVER function.
For example: CROSSOVER(EMA(CLOSE,20),SMA(CLOSE,50))==TRUE
This version checks when the 20-period exponential moving average crosses above the 50-period simple moving average. When this condition is met, a BUY order will be triggered.
To set up the EXIT LONG signal:
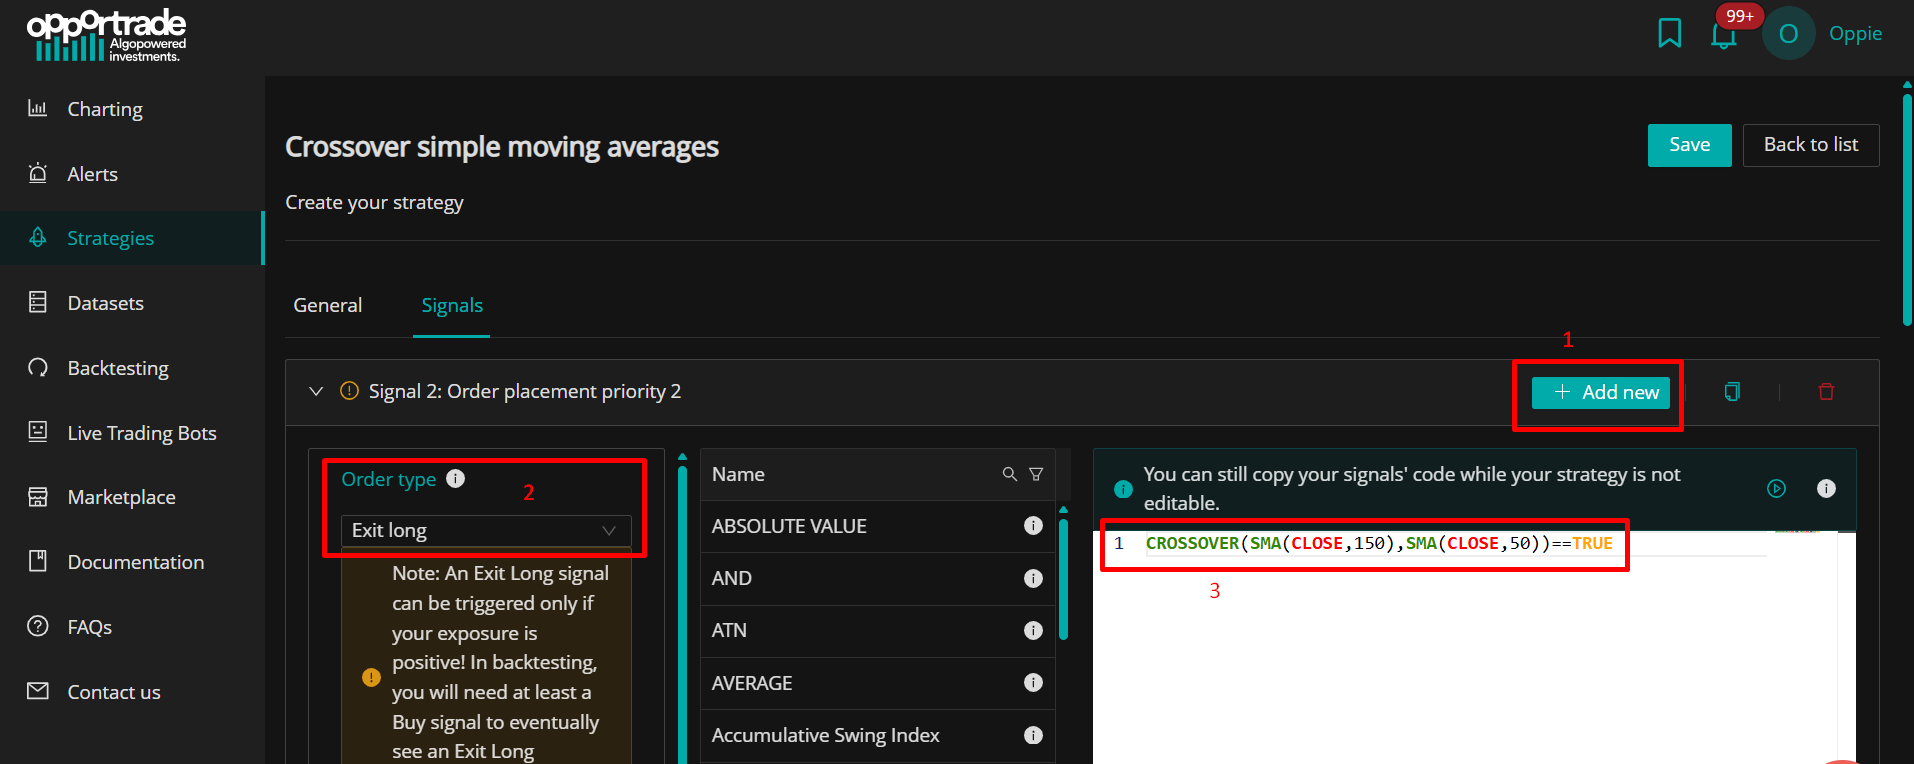
Click the Add new button
Choose EXIT LONG in the Order type section
Paste the following formula into the Tradescript editor: CROSSOVER(SMA(CLOSE,150),SMA(CLOSE,50))==TRUE
Configure the remaining order settings and save
This rule will trigger an EXIT LONG order whenever the 150-period simple moving average crosses above the 50-period one—indicating a possible end to the uptrend.
Note:
You can customize this signal by changing the type or length of the moving averages used in the CROSSOVER function.
For example: CROSSOVER(SMA(CLOSE,50),EMA(CLOSE,20))==TRUE
This condition checks when the 50-period simple moving average crosses below the 20-period exponential moving average. When this happens, the EXIT LONG order will be placed.
This strategy has the following advantages:
Beginner-Friendly
It’s straightforward to understand and quick to apply on any trading platform. No coding or complex analysis required.
Trend Visibility
Moving averages help highlight the general direction of the market and can make reversals more apparent.
Flexible Across Timeframes
This approach works whether you're day trading, holding for weeks, or investing long term.
Less Noise, More Clarity
Short-term volatility can distort the picture—averages smooth out that noise to make trends easier to read.
Things to Keep in Mind:
Lagging by Nature
Since they rely on past data, moving averages respond with a delay. You might miss sharp, sudden moves.
Not Ideal in Sideways Markets
In choppy conditions, crossovers can trigger frequent, false signals.
Trend-Dependent
This strategy shines in trending markets but tends to struggle when prices move sideways.
If you’re just getting started with algorithmic trading, moving average crossovers offer a solid foundation. They're easy to learn, quick to test, and widely available on charting tools. Just remember: no strategy works in every condition. For better performance, consider combining crossovers with additional indicators—and always take market context into account.