Moving Average Convergence Divergence (MACD) trading strategies are popular among traders for their simplicity and effectiveness. These strategies revolve around the MACD indicator – a tool that helps identify trend momentum and potential reversal points. In this article, we’ll break down what MACD trading strategies are, how the MACD indicator works, the different types of MACD strategies, and how you can build an MACD strategy on Opportrade. We’ll also cover the pros and cons of using MACD strategies in your trading arsenal.
MACD trading strategies use signals from the MACD indicator to decide when to buy or sell an asset. Essentially, traders watch how the MACD line interacts with its signal line (and the MACD histogram) to find entry and exit points. A classic MACD strategy is to buy when the MACD line crosses above its signal line (indicating bullish momentum) and sell when it crosses below (indicating bearish momentum). Traders may also look for discrepancies between MACD and price (known as divergences) to spot possible trend reversals. In short, any trading approach that leverages these MACD-based signals can be considered a MACD trading strategy.

MACD stands for Moving Average Convergence Divergence. It’s a popular technical indicator, developed by Gerald Appel in the late 1970s, and is used across markets (stocks, forex, crypto) to identify changes in trend direction and momentum. MACD is essentially a trend-following momentum indicator that shows the relationship between two moving averages of price. How does MACD work? It consists of two lines on a chart (and often a histogram).
The MACD line is calculated by taking the difference between a shorter-term moving average and a longer-term moving average (commonly 12-periods moving average minus 26-periods moving average). The second line, called the signal line, is a 9-period moving average of the MACD line. Typically an exponential moving average is used for caclulating the MACD, but also other types of moving averages can be used. When these two lines interact, they produce trading signals – for example, the MACD line crossing above the signal line can trigger a buy signal.
The MACD histogram, typically plotted as vertical bars, represents the difference between the MACD line and the signal line. This histogram gives a visual sense of momentum strength: it’s positive when MACD is above the signal line and negative when MACD is below the signal line. Traders read the histogram’s size and direction to gauge whether bullish or bearish momentum is increasing or fading.
There are several ways to trade using MACD. Here are some of the common MACD strategy types and how they work:
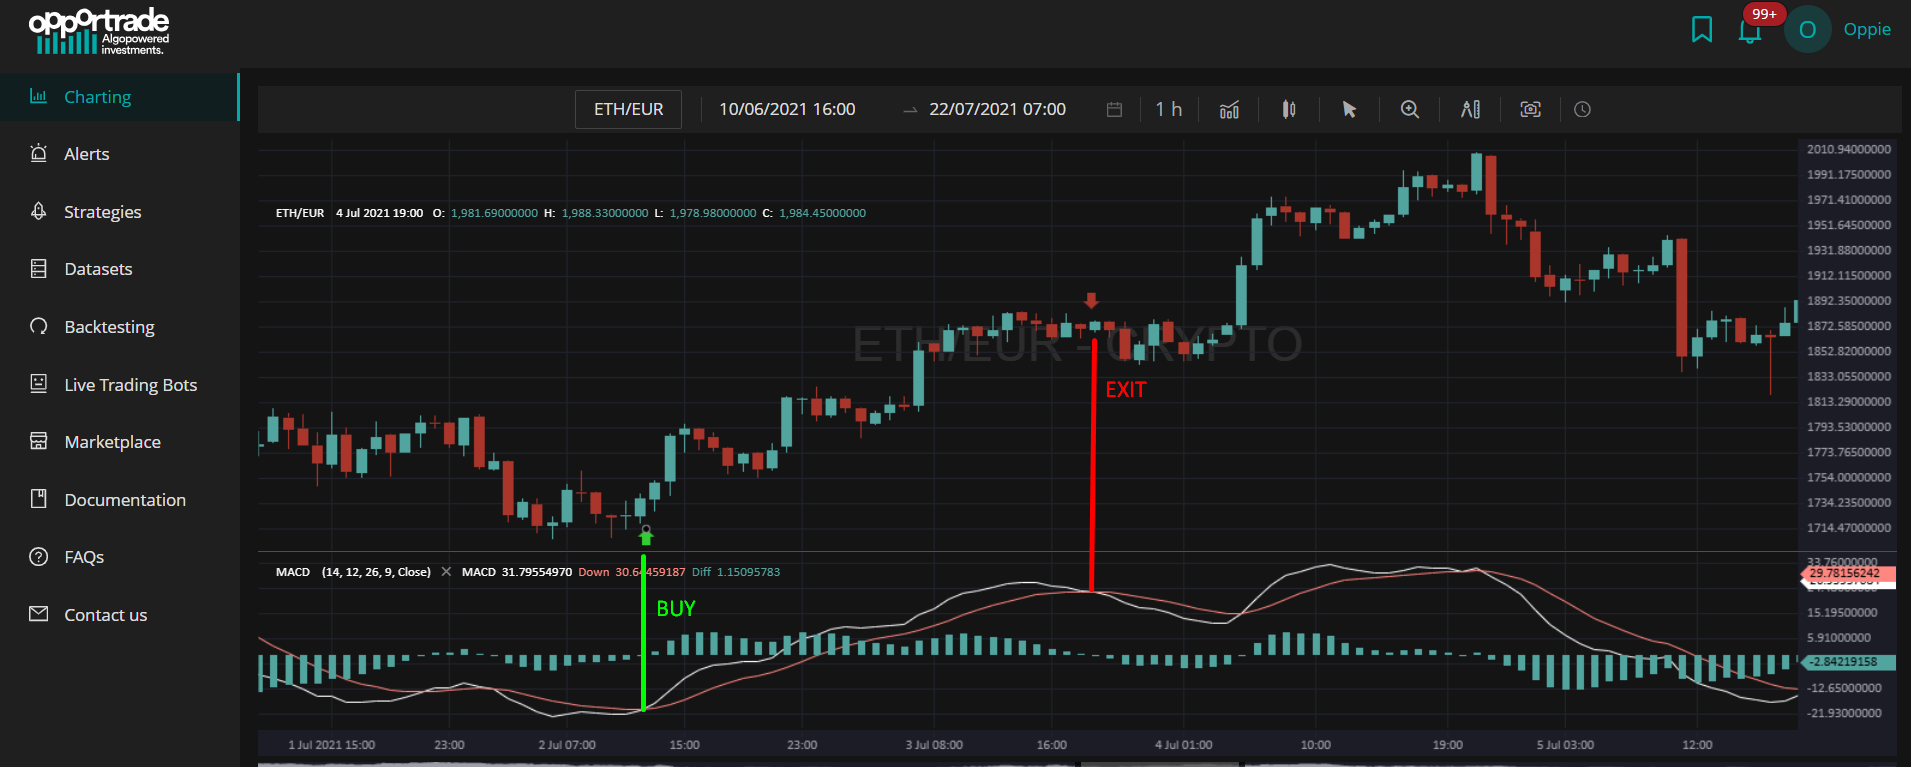
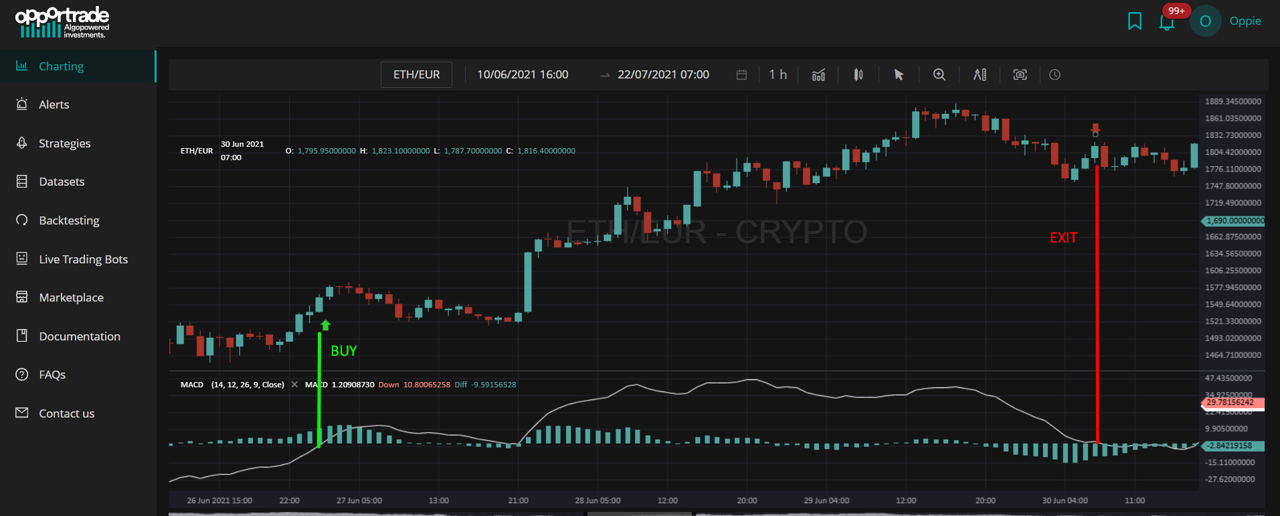
This is the most well-known strategy. It generates a bullish signal when the MACD line crosses above its signal line, and a bearish signal when the MACD line crosses below the signal line. In practice, a crossover indicates a shift in momentum – for example, a bullish crossover suggests the asset’s short-term momentum is rising faster than the longer-term trend, hinting at an upward move.


This approach looks at the MACD line relative to the zero level. When MACD crosses from below zero to above, it signals a transition from negative to positive momentum (often interpreted as a bullish sign). If MACD crosses from above zero to below, it signals a swing to negative momentum (a bearish sign). Traders use zero-line crossovers to confirm trend direction; for instance, taking long positions when MACD turns positive and short positions when it turns negative.
A divergence occurs when the MACD indicator is telling a different story than the price action. In other words, price is moving in one direction, but MACD is moving in the opposite — a potential sign that the current trend is losing strength.
There are two main types of divergence:
Bullish Divergence
This happens when the price makes a lower low, but the MACD makes a higher low.
In simple terms: while the price continues to drop, the MACD doesn’t fall as far as it did before. This suggests that the downward momentum is fading, and a reversal to the upside might be near.
Example:
Price: 100 → 90 → 80 (lower and lower)
MACD: -5 → -4 → -2 (falling less — a higher low)
This pattern can signal that the selling pressure is weakening, and buyers may be starting to take control.
Bearish Divergence
This occurs when the price makes a higher high, but the MACD makes a lower high.
In this case, even though the price is climbing, the MACD is rising with less strength than before — a warning that the bullish momentum might be running out of steam.
Example:
Price: 100 → 110 → 120 (higher highs)
MACD: 3.5 → 3 → 2 (lower highs)
This kind of divergence can suggest a potential downward reversal on the horizon.
A word of caution:
Divergences can be early warnings of trend changes, but they aren’t always reliable on their own. It’s a good idea to confirm them with other signals, such as support/resistance levels or price action patterns, before acting on them.
Some strategies focus on the MACD histogram to gauge the strength of momentum changes. The histogram is positive when MACD is above the signal line (bullish momentum) and negative when MACD is below the signal (bearish momentum). Traders watch its bars growing or shrinking: rising histogram bars (or a flip from negative to positive) mean momentum is accelerating upward, while a falling histogram (or flip to negative) means momentum is slowing or turning downward. Using the histogram, a trader might enter a trade when momentum visibly increases and exit when momentum starts to fade.

Building a MACD trading strategy on Opportrade is straightforward, even if you’re not a coding expert. Opportrade is a platform that lets you create, test, and automate trading strategies on various assets.
In the next paragraphs we will show you how to easily create a MACD Line Crossover strategy on Opportrade, but if you prefer to get this ready-to-use MACD strategy built by the Opportrade Team, you can get if for free on our Marketplace:
To build a MACD Crossover strategy in Opportrade, simply head over to the Strategy section, open the Signals tab, and add:
a BUY signal when the MACD line crosses above the Signal Line
an EXIT LONG signal when the MACD line crosses below the Signal Line
Here’s how to create the BUY signal:
Click the Add new button
In the Order type field, select BUY
In the Tradescript editor, paste the following formula: CROSSOVER(MACD(8, 26, 7, SIMPLE), MACDSignal(8, 26, 7, SIMPLE)) == TRUE
Configure the remaining order parameters and save the signal
This condition will generate a BUY order every time the MACD line crosses above the MACD Signal line.
Note:
If you'd like to adjust the MACD or the Signal line parameters, you can just change them in the formula.
For example, if you want to change the periods of the “slow moving average” of the MACD from 26 to 30, you can modify the parameters of the MACD formula into: MACD(8, 30, 7, SIMPLE)

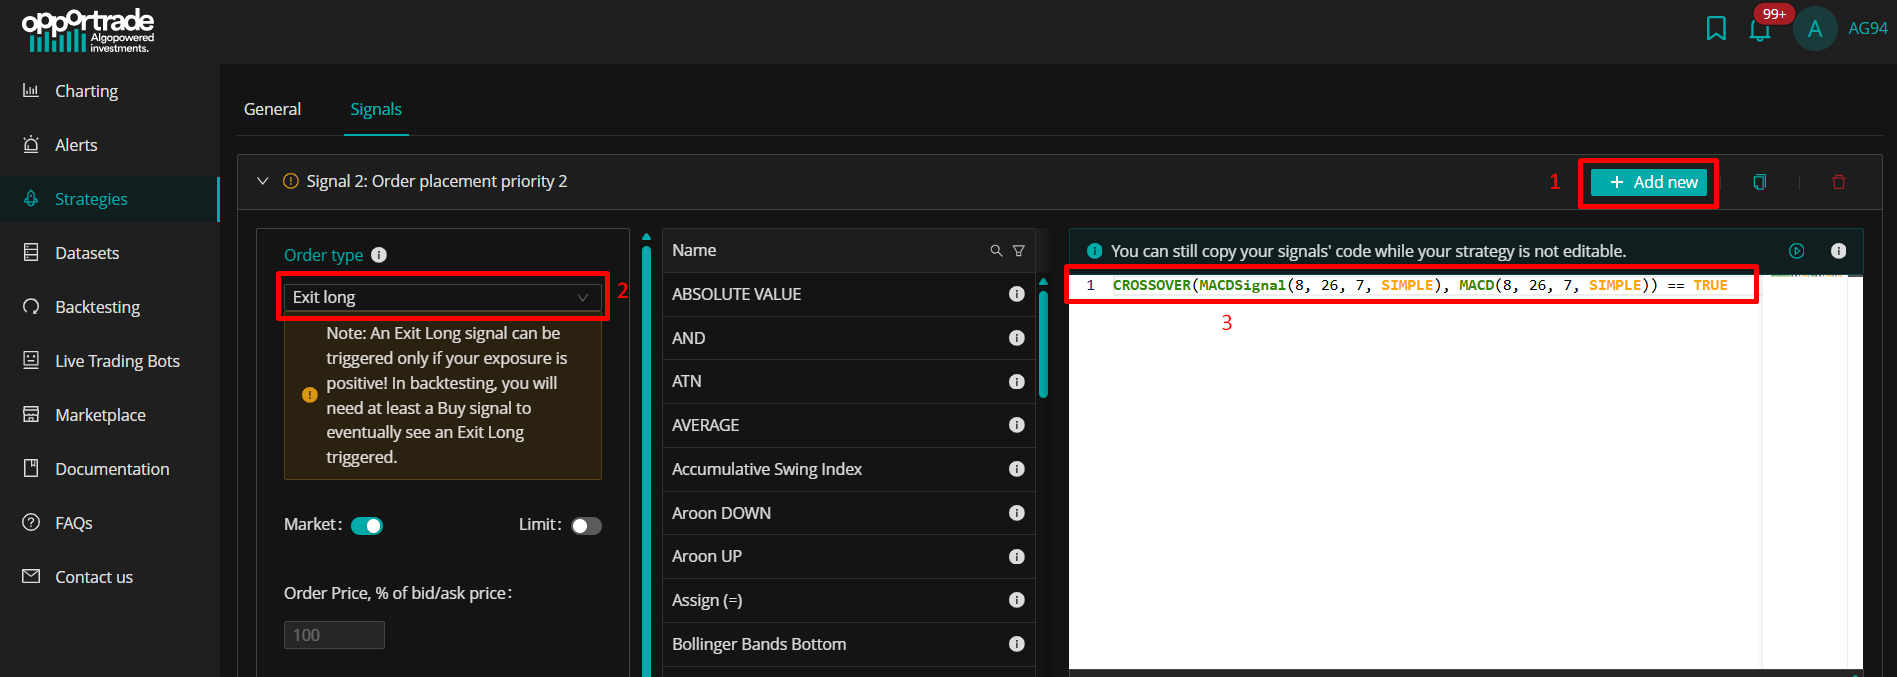
Here’s how to create the EXIT LONG signal:
Click the Add new button
In the Order type field, select EXIT LONG
In the Tradescript editor, paste the following formula: CROSSOVER(MACDSignal(8, 26, 7, SIMPLE), MACD(8, 26, 7, SIMPLE)) == TRUE
Configure the remaining order parameters and save the signal
This condition will generate an EXIT LONG order every time the MACD line crosses below the MACD Signal line.
Note:
If you'd like to adjust the MACD or the Signal line parameters, you can just change them in the formula.
For example, if you want to change the periods of the “slow moving average” of the MACD from 26 to 30, you can modify the parameters of the MACD formula into: MACD(8, 30, 7, SIMPLE)

Easy-to-Use Signals: MACD strategies are relatively simple to understand and follow. Signals like line crossovers are clear and intuitive, making MACD a beginner-friendly indicator. In fact, the classic MACD crossover strategy’s main appeal is that it’s straightforward and easy to implement.
Widely Applicable: The MACD indicator works across different markets and timeframes. Traders use MACD to pinpoint entry and exit points in stocks, commodities, forex, and crypto markets. This versatility means a well-crafted MACD strategy can be applied to many assets.
Momentum & Trend Insight: MACD does a good job of highlighting momentum shifts and trend changes. It has been a reliable tool for identifying trend reversals and momentum in price data. When an MACD signal confirms a trend, traders can ride substantial moves with confidence that momentum is on their side.
False Signals in Choppy Markets: Like any indicator, MACD isn’t perfect. In sideways or volatile ranging markets, MACD can give false signals – for example, indicating a bullish crossover that quickly reverses into a loss. Whipsaws can happen, so it’s important to use stop-losses or additional confirmation in such conditions.
Underperforms in Sideways Trends: MACD works best when an asset is trending. In flat markets with no clear uptrend or downtrend, MACD tends to hover around zero and its signals become less meaningful. Traders might find multiple crossover signals that don’t lead to any significant price movement, resulting in frustration or small losses.
Lagging Indicator: Because MACD is based on moving averages (which are trailing price data), its signals often lag the market. A new trend may already be underway by the time MACD confirms it. For instance, the price might have moved considerably off a bottom before MACD crosses above zero, causing you to enter later than the ideal price. This lag can reduce potential profit or cause late exits.
Needs Confirmation: MACD isn’t a standalone magic bullet. It has its limitations and should ideally be used in combination with other indicators or analysis methods. Many traders confirm MACD signals with tools like RSI, support/resistance levels, or volume data to improve accuracy. Relying on MACD alone, without regard for broader context, can be risky.
MACD trading strategies remain a cornerstone of technical trading due to their balance of simplicity and insight. By tracking the convergence and divergence of moving averages, MACD gives traders a window into the market’s momentum and potential trend shifts. When used wisely – and especially when enhanced with modern tools like AI optimization – MACD strategies can significantly improve trading performance. Platforms like Opportrade make it easier than ever to design and optimize these strategies, lowering the barrier for everyday traders to harness the power of MACD.
That said, no strategy is infallible. It’s important to backtest your MACD strategy and remain vigilant, as market conditions can change. Use the pros of MACD to your advantage (clear signals and momentum tracking) while mitigating the cons (false signals and lag) through risk management and complementary analysis. In conclusion, MACD strategies can be a valuable part of your trading toolkit, and with a bit of practice (and perhaps some AI help), you can tailor them to fit your trading style and goals for consistent, positive results.