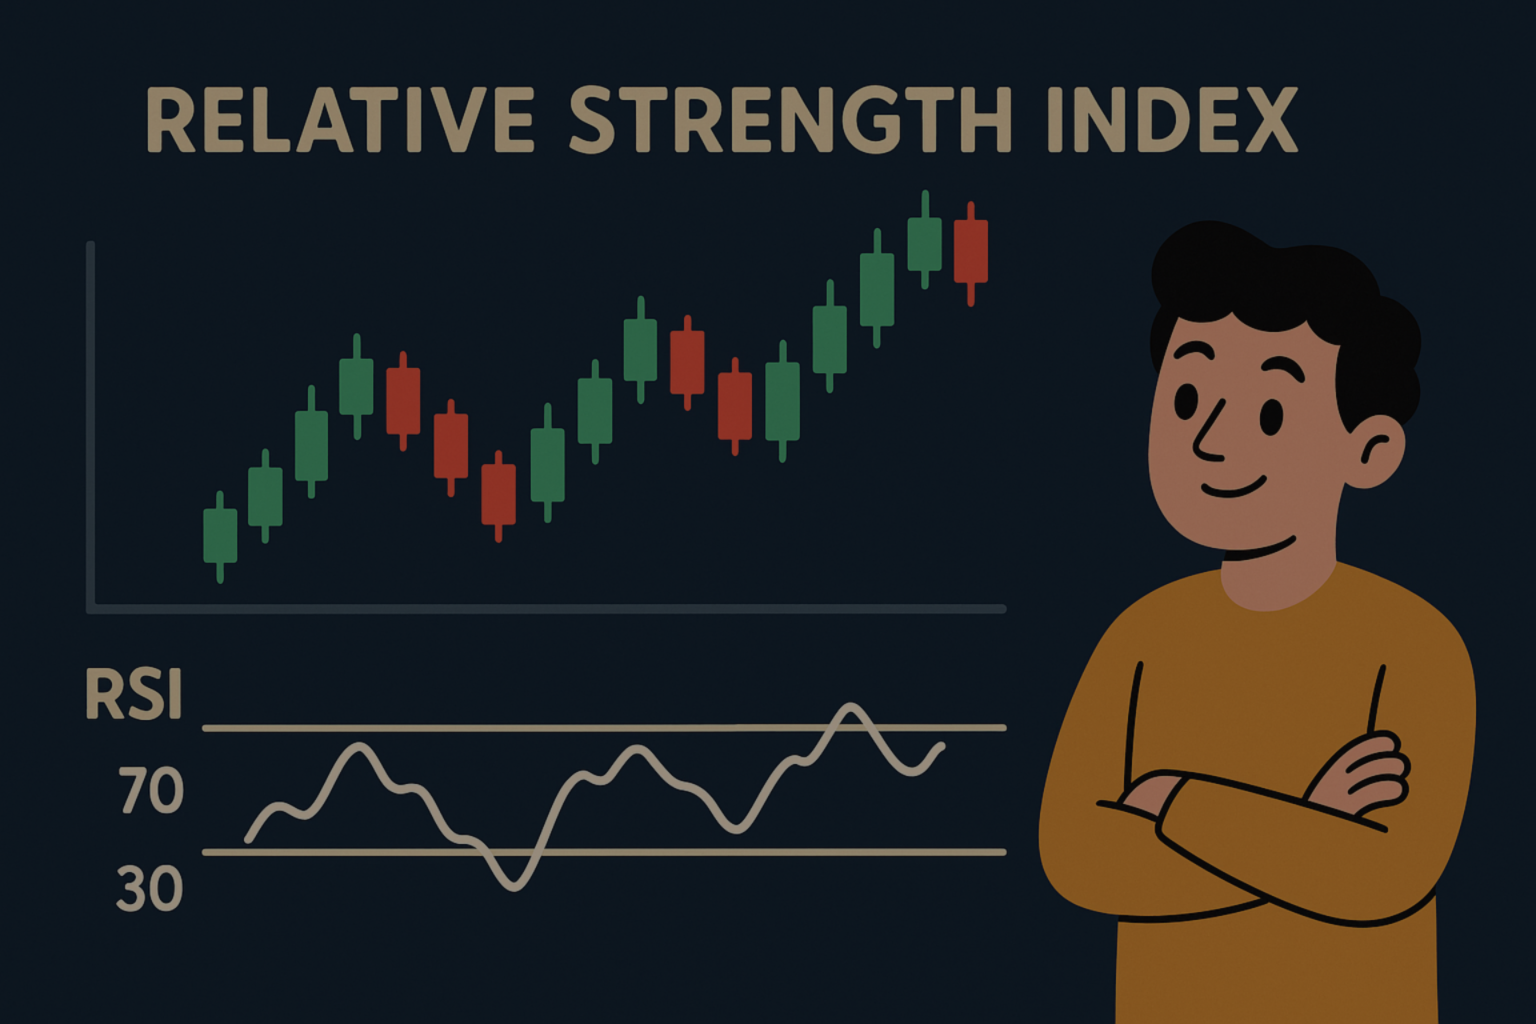
RSI strategies are trading methods that use the RSI indicator to guide buy and sell decisions. Essentially, they are sets of rules and techniques that leverage RSI signals — typically overbought/oversold conditions or changes in trend strength — to identify potential entry or exit points.
Traders can apply RSI strategies in multiple markets (stocks, forex, crypto, etc.) and across different timeframes, adapting them to their trading style. There are several common approaches to using RSI, such as overbought/oversold signals, 50-level crossovers, or divergences between RSI and price. Each approach interprets the indicator in a specific way to anticipate trend reversals or momentum changes.
The RSI (Relative Strength Index) is a momentum oscillator developed by J. Welles Wilder in the 1970s. It ranges from 0 to 100 and measures the speed and magnitude of recent price movements, giving traders a sense of buying or selling pressure.
RSI is calculated by comparing the average gains and losses over a specific period (commonly 14 days). Conventionally:
Above 70 → overbought conditions (price may have risen too fast)
Below 30 → oversold conditions (price may have dropped too fast)
These thresholds are not absolute, but they help highlight situations where the price might be overextended and could be approaching a trend reversal. RSI oscillates around 50, which acts as a midpoint:
Above 50 → bullish momentum dominates
Below 50 → bearish momentum dominates
There are several popular ways to build trading strategies with RSI. Here are the main approaches:
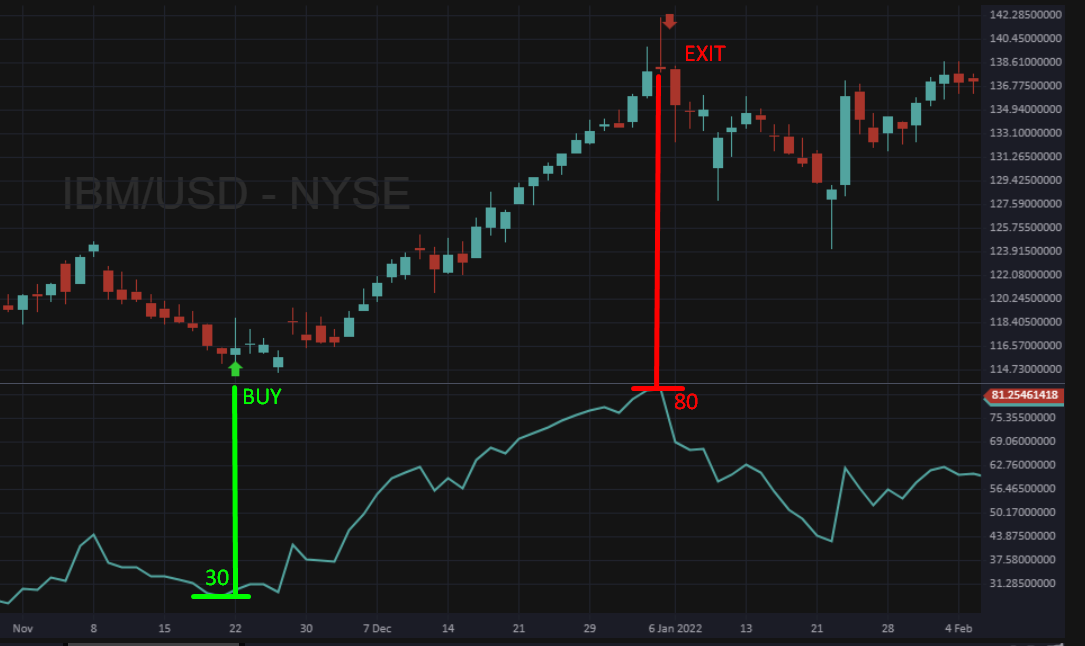
This is the simplest RSI strategy. Traders look for RSI to enter the overbought zone (above 70) or the oversold zone (below 30) and then reverse direction. For example, a common practice is to sell (or short) when RSI falls back below 70 after being overbought, or buy (go long) when RSI rises back above 30 after being oversold. This strategy anticipates price corrections after extreme moves.
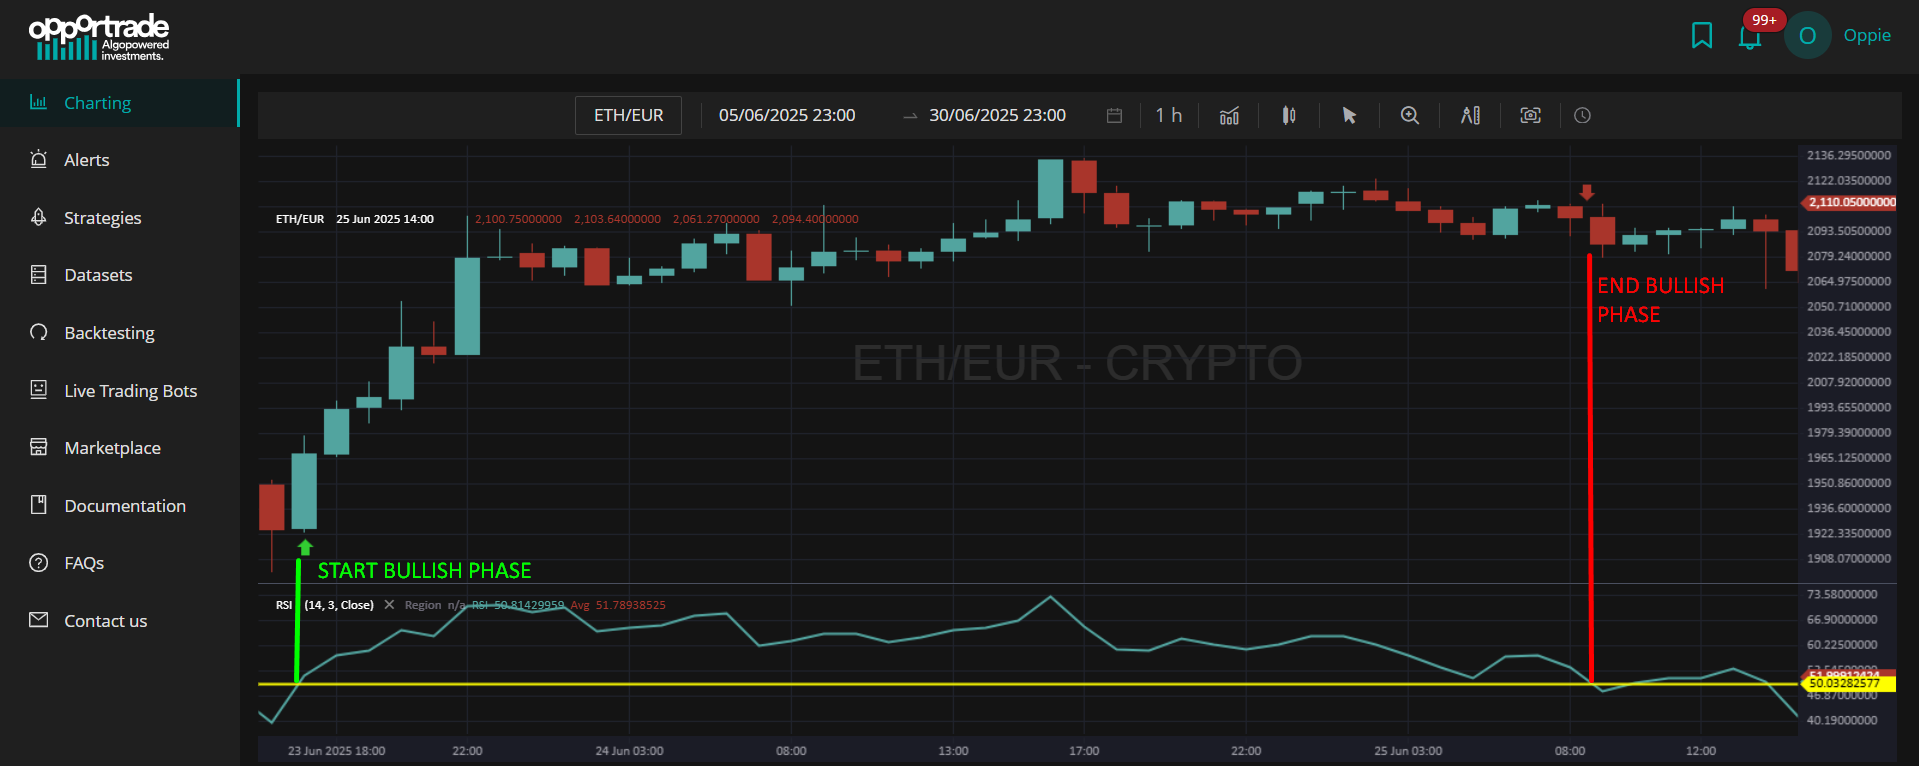
This strategy uses the RSI midpoint of 50 as a signal line between bullish and bearish momentum. RSI crossing above 50 can confirm an emerging uptrend, while crossing below 50 indicates a developing downtrend. Traders use these crossovers as confirmation signals for trend direction.
Divergences occur when RSI movements disagree with price movements. A bearish divergence happens when prices form higher highs, but RSI creates lower highs, indicating weakening upward momentum and possible reversal to the downside. Conversely, bullish divergence occurs when prices form lower lows, but RSI shows higher lows, signaling diminishing downward momentum and a potential upward reversal. Divergence can be an early indication of a trend reversal, but it's usually advisable to confirm with other signals or indicators.
Less common but notable, a failure swing occurs when RSI makes an unsuccessful attempt to reach a new high or low. For instance, if RSI moves above 70, retreats slightly, then attempts—but fails—to surpass its previous high, this indicates weakening momentum and signals a possible reversal. Similarly, a failure swing at the oversold level suggests a potential upward reversal.

Building an RSI trading strategy on Opportrade is simple, even if you don’t know how to code. Opportrade is a platform that allows you to create, test, and automate trading strategies on different assets.
In the next sections, we’ll show you the results of a Long-Short strategy based on RSI levels 26 and 83, built and tested on Opportrade. The strategy was tested and optimized on American Airlines (AAL) stock, using 30-minute candles over the past 2 years, achieving returns of over 40% compared to a market performance of -14.89%.
At the end of this article, we’ll also teach you how to build it yourself in Opportrade. However, if you want to get this RSI strategy ready to use, built by the Opportrade Team, you can Download from Marketplace for free.
This strategy was designed and optimized to exploit the overbought and oversold levels of American Airlines, tested on the period January 2023 – August 2025, using 30-minute candles. The strategy is programmed to:
Buy 500 AAL shares (closing any existing short positions first) whenever the 12-period RSI rises back above the 26 oversold threshold.
Sell short 500 AAL shares (closing any existing long positions first) whenever the 12-period RSI falls back below the 83 overbought threshold.
Attach a 7% Stop Loss to each open long position (empirical testing showed that in this strategy such a stop loss reduces drawdown and improves returns).
Never have an exposure greater than 500 shares (both long and short). As a result, the strategy will never place two consecutive BUY orders or two consecutive SELL orders.
Of course, the strategy can be adapted and re-optimized on other assets and different candle sizes by simply adjusting the parameters in the TradeScript functions. If you want to make it long-only, just remove the SELL and EXIT SHORT signals from the strategy.
The backtest was performed on 30-minute candles of American Airlines (symbol: AAL/USD), from the beginning of 2023 until the end of August 2025. It was set with an initial capital of 10,000 USD, commissions at 0.03%, spread at 0.02%, and assuming 100% margin. In this way, positions are fully financed by available margin, without simulating any type of leverage.
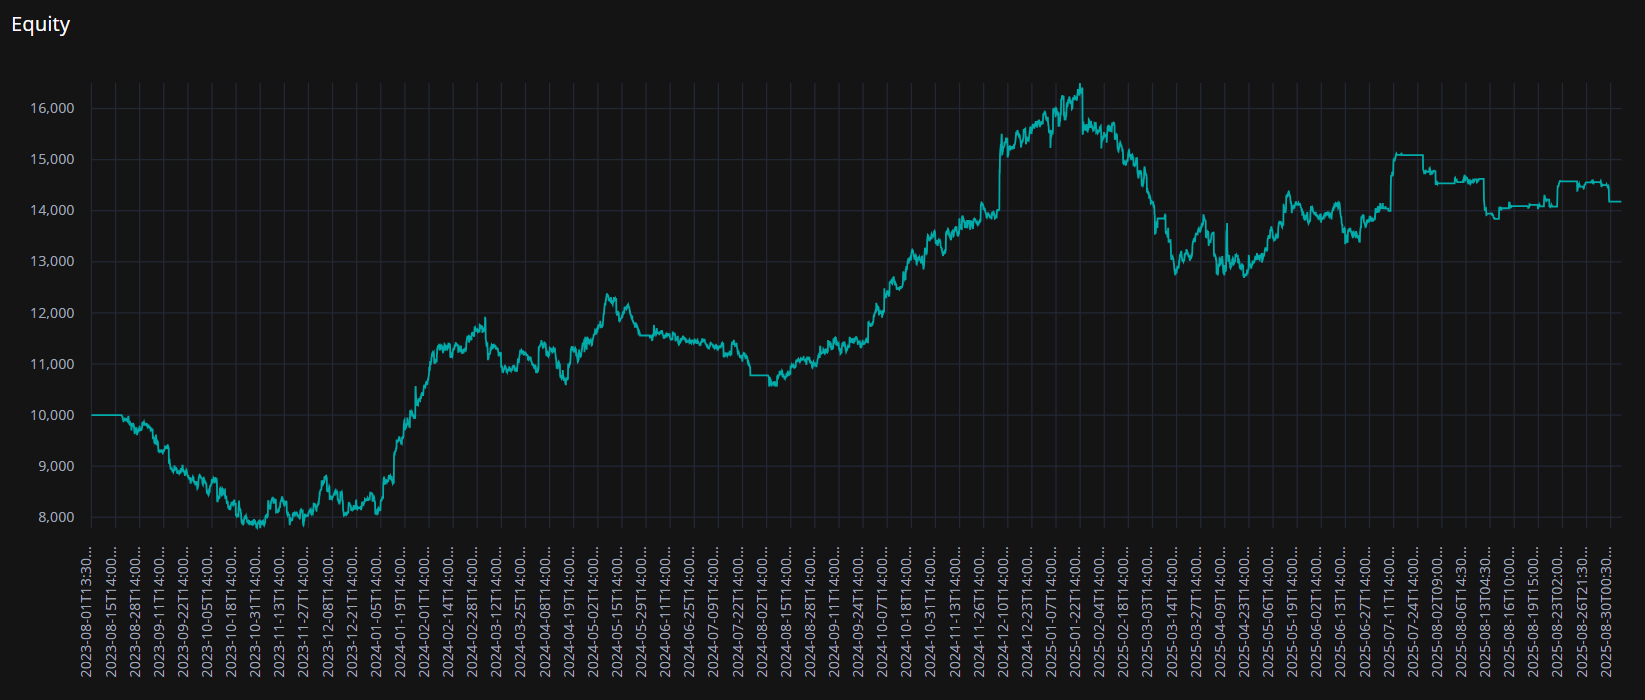
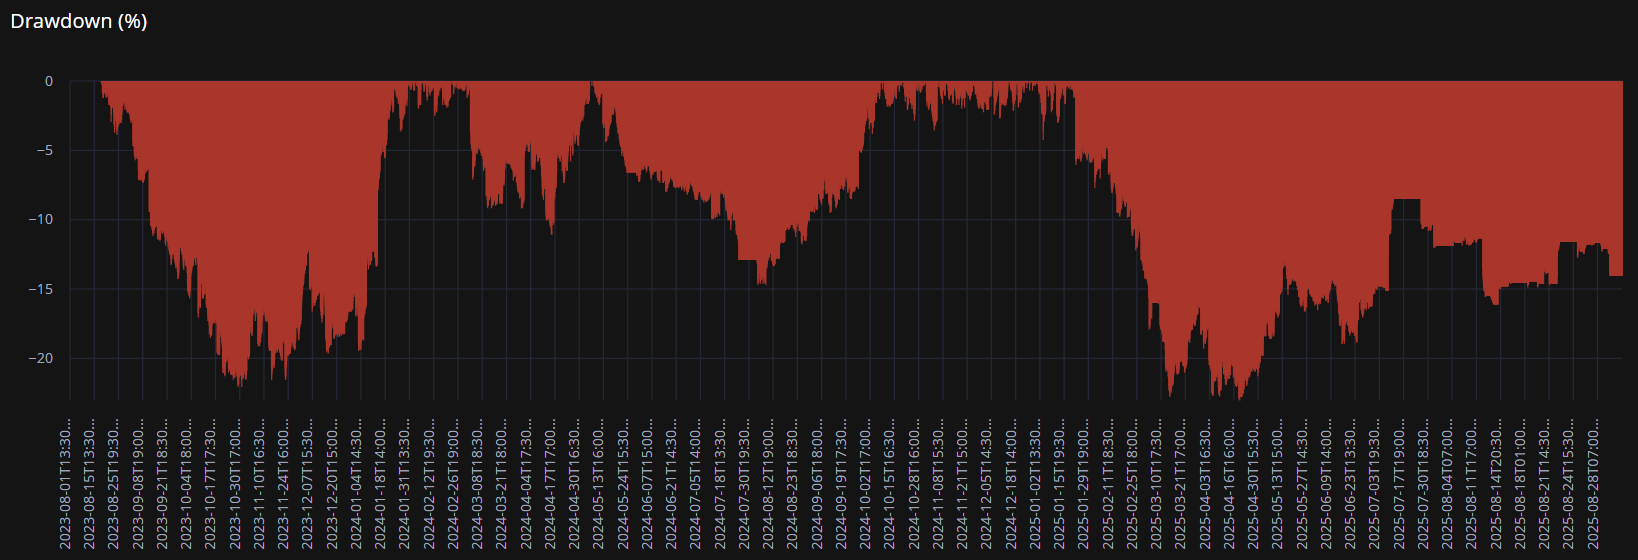
The backtest produced a net return of 41.79%, compared to a negative market return of -14.89%, executing a total of 99 orders, with 26 profitable exits and 23 losing exits, and a maximum drawdown of 23%.
Key results from our backtest (including equity line and drawdown line):
Initial capital: 10,000 USD
Final capital: 14,179 USD
Net return (%): 41.79%
Market performance: -14.89%
Maximum drawdown: 23%
Realized PNL: 4,737.27 USD
Commissions paid: 191.28 USD
Unrealized PNL (end of backtest): -366.32 USD
Total orders (entries + exits): 99
Average monthly orders: 4
Profitable exits: 26
Losing exits: 23
Stirling ratio: 0.93
Calmar ratio: 0.79
The backtest results shown are for illustrative and educational purposes only. Past performance does not guarantee future results: market conditions may change significantly and unpredictably. Opportrade recommends thoroughly testing any strategy before using it in a Live Trading environment. Investing in financial instruments carries risks, including the possibility of losing part or all of your invested capital.
Since this strategy continuously switches between long and short positions, exit signals must be defined before the entry signals in the opposite direction.
For example:
Define the Exit Long signal before the Sell signal.
Define the Exit Short signal before the Buy signal.
This is because Buy or Sell signals in Opportrade are designed to open long or short positions. If there is already an open position in the opposite direction when a Buy/Sell signal is triggered, the system will ignore it — first it’s necessary to close the opposite position!
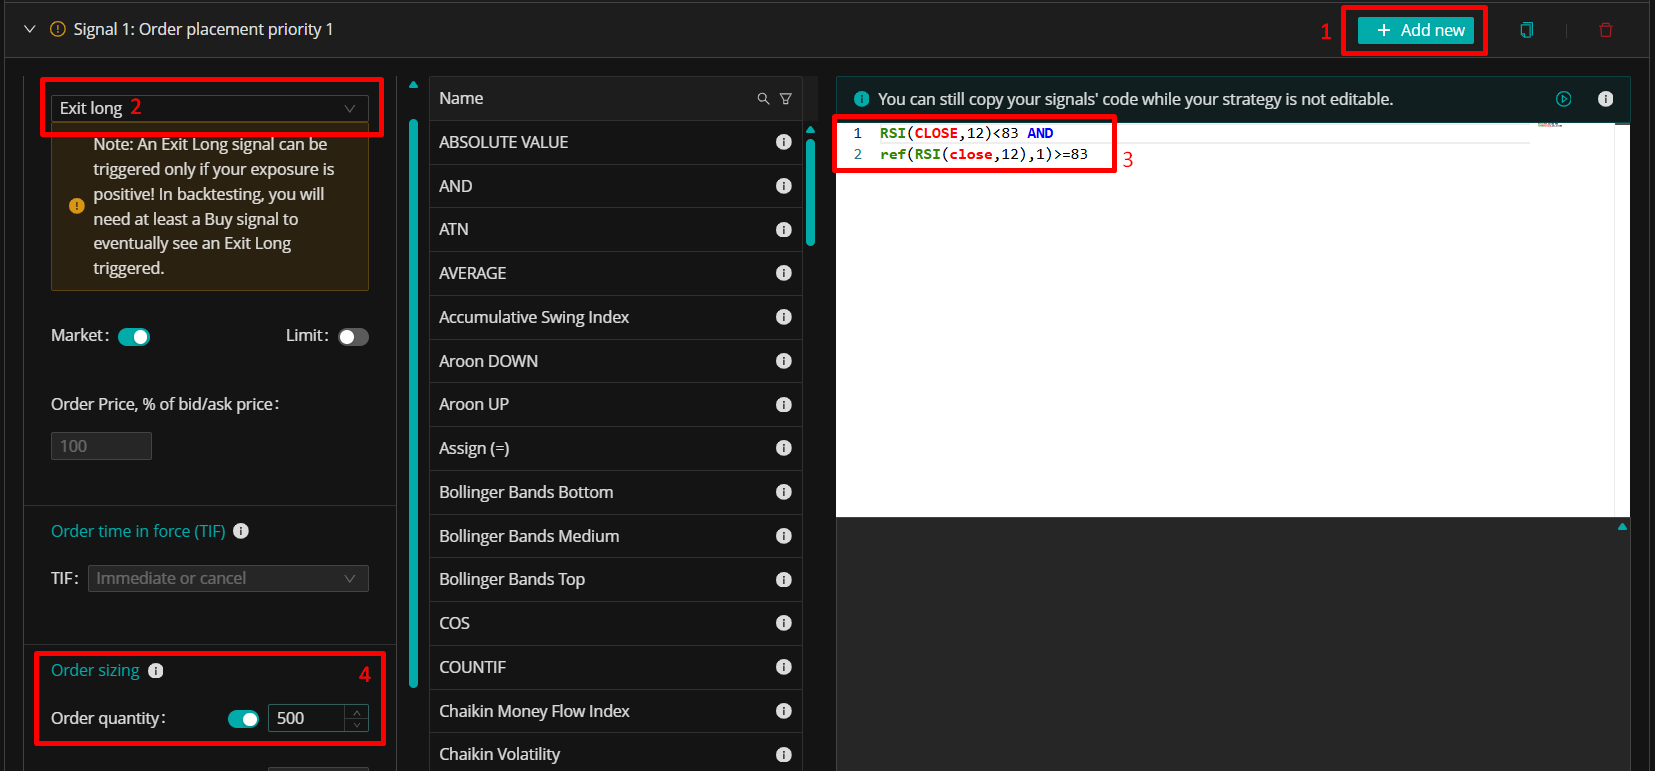
How to create the Exit Long Signal
Click on Add new
In the Order type field, select EXIT LONG
In the Tradescript editor, paste the following formula: RSI(CLOSE,12)<83 AND ref(RSI(close,12),1)>=83
Explanation: ref(RSI(close,12),1) means the RSI on the previous candle was above level 83. RSI(CLOSE,12)<83 means the current RSI is below 83. Together, these conditions close an open long position whenever RSI crosses down through 83.
Note: the REF function lets you reference past candles. For example: ref(RSI(close,12),1) is the RSI value from the previous candle, while ref(RSI(close,12),5) is the RSI value from 5 candles ago
In the Order quantity field, enter 500
Save
Customizing the RSI: if you want to change the RSI parameters, simply edit them inside the formula.
Example:
To change the RSI period from 12 to 28, modify the formula to RSI(CLOSE,28)
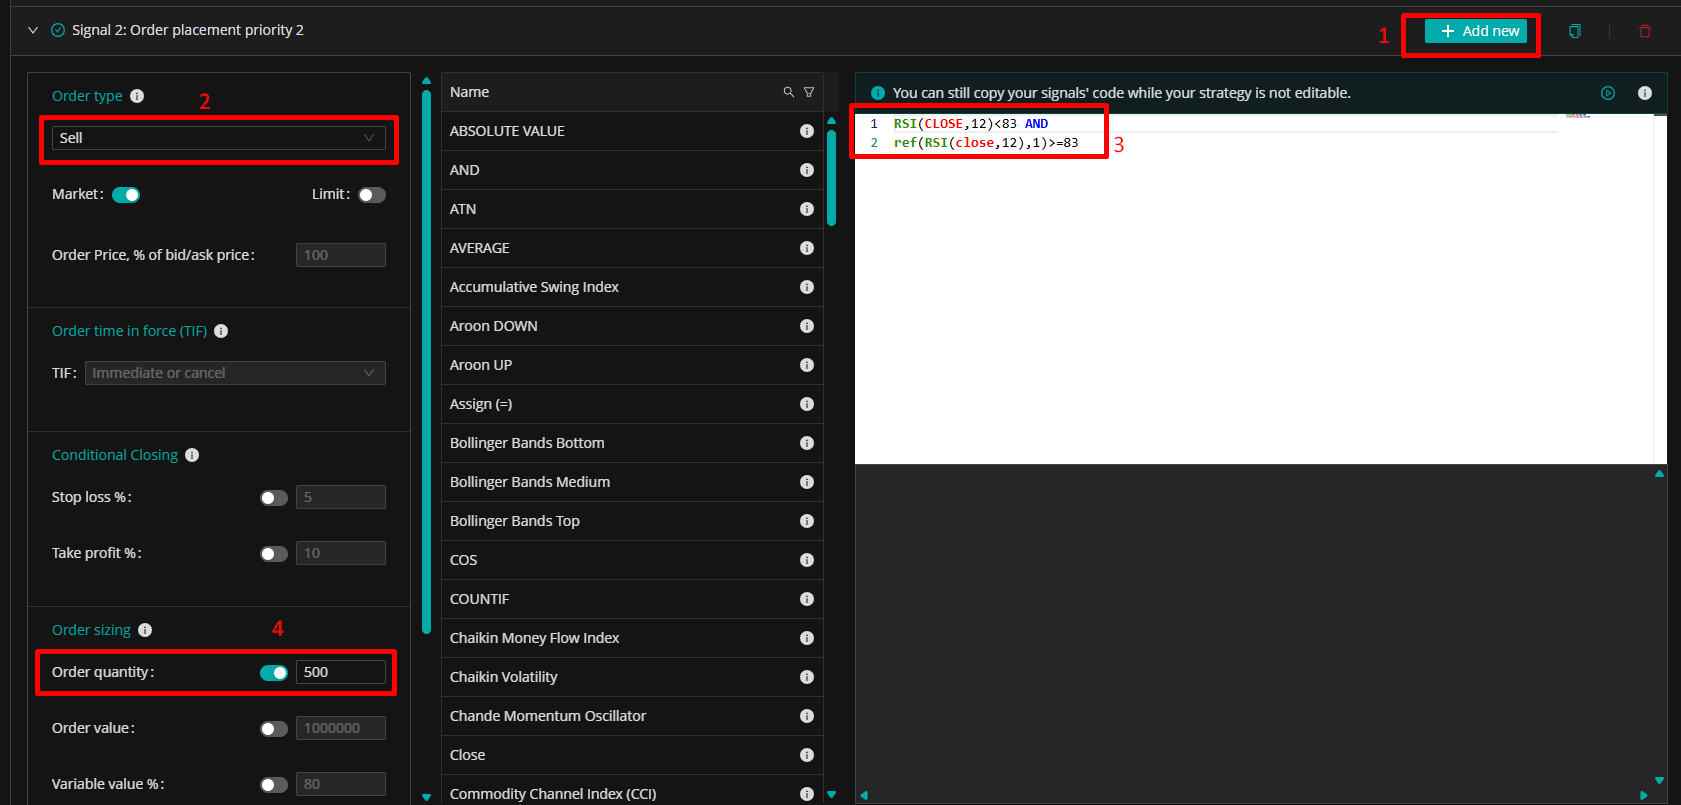
The Sell signal is used to short 500 shares whenever the RSI drops below the overbought threshold.
Here’s how to create the Sell signal:
Click on the Add new button
In the Order type field, select SELL
In the Tradescript editor, paste the following formula: RSI(CLOSE,12)<83 AND ref(RSI(close,12),1)>=83
Note: The formula is exactly the same as for the Exit Long signal, because when the RSI falls below 83 we want the system to close any open long position and immediately open a short position.
Enter 500 in the Order quantity field and save the signal
This condition will open a short position every time the RSI goes below 83.
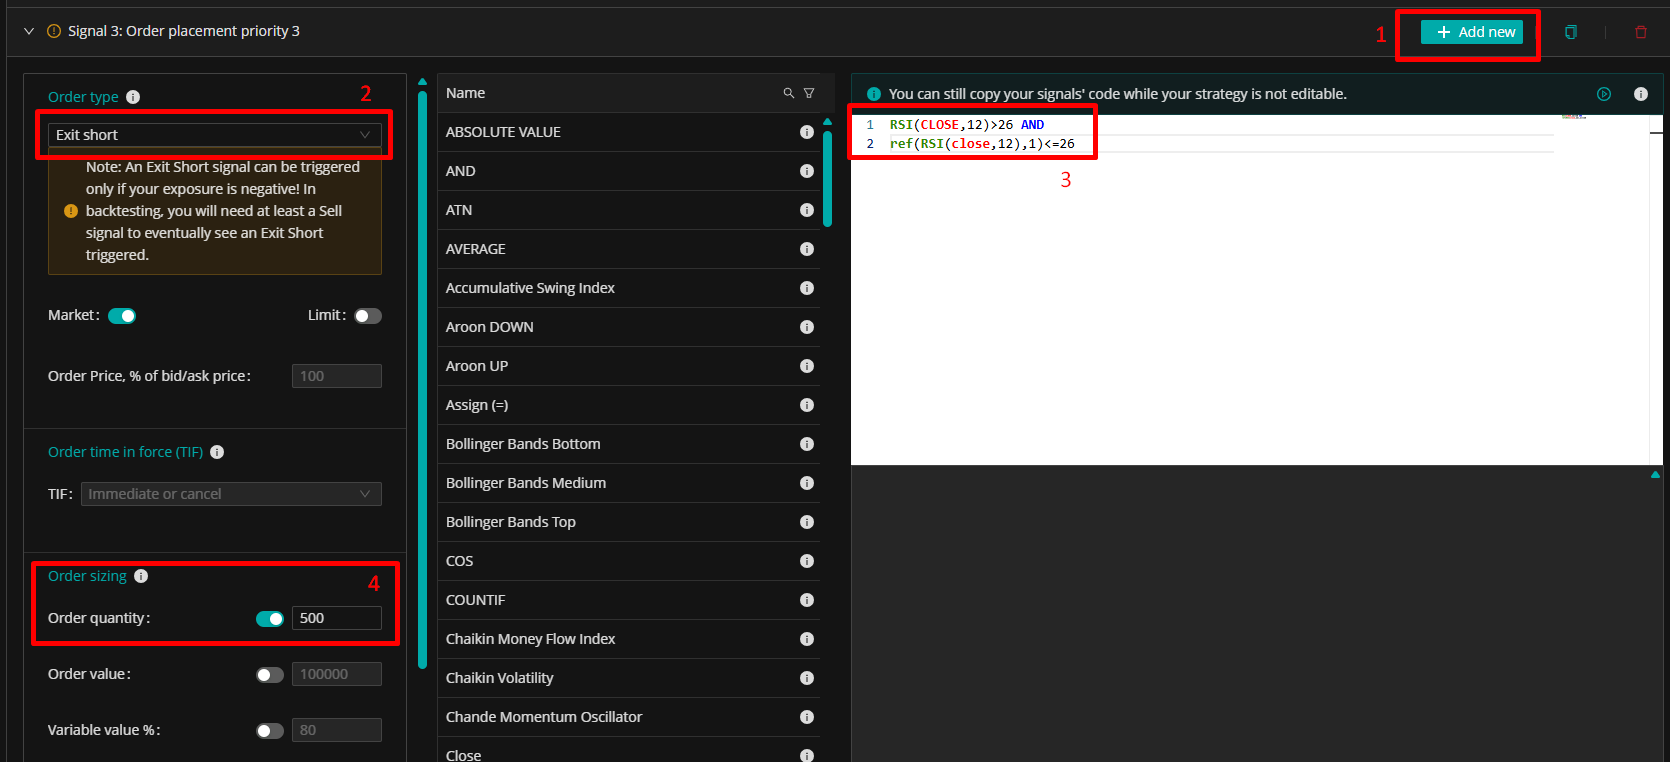
As with Exit Long and Sell, you should define the Exit Short signal before the Buy signal, so the system can close any open short positions before proceeding with the purchase.
Here’s how to create the EXIT SHORT signal:
Click on Add new
In the Order type field, select EXIT SHORT
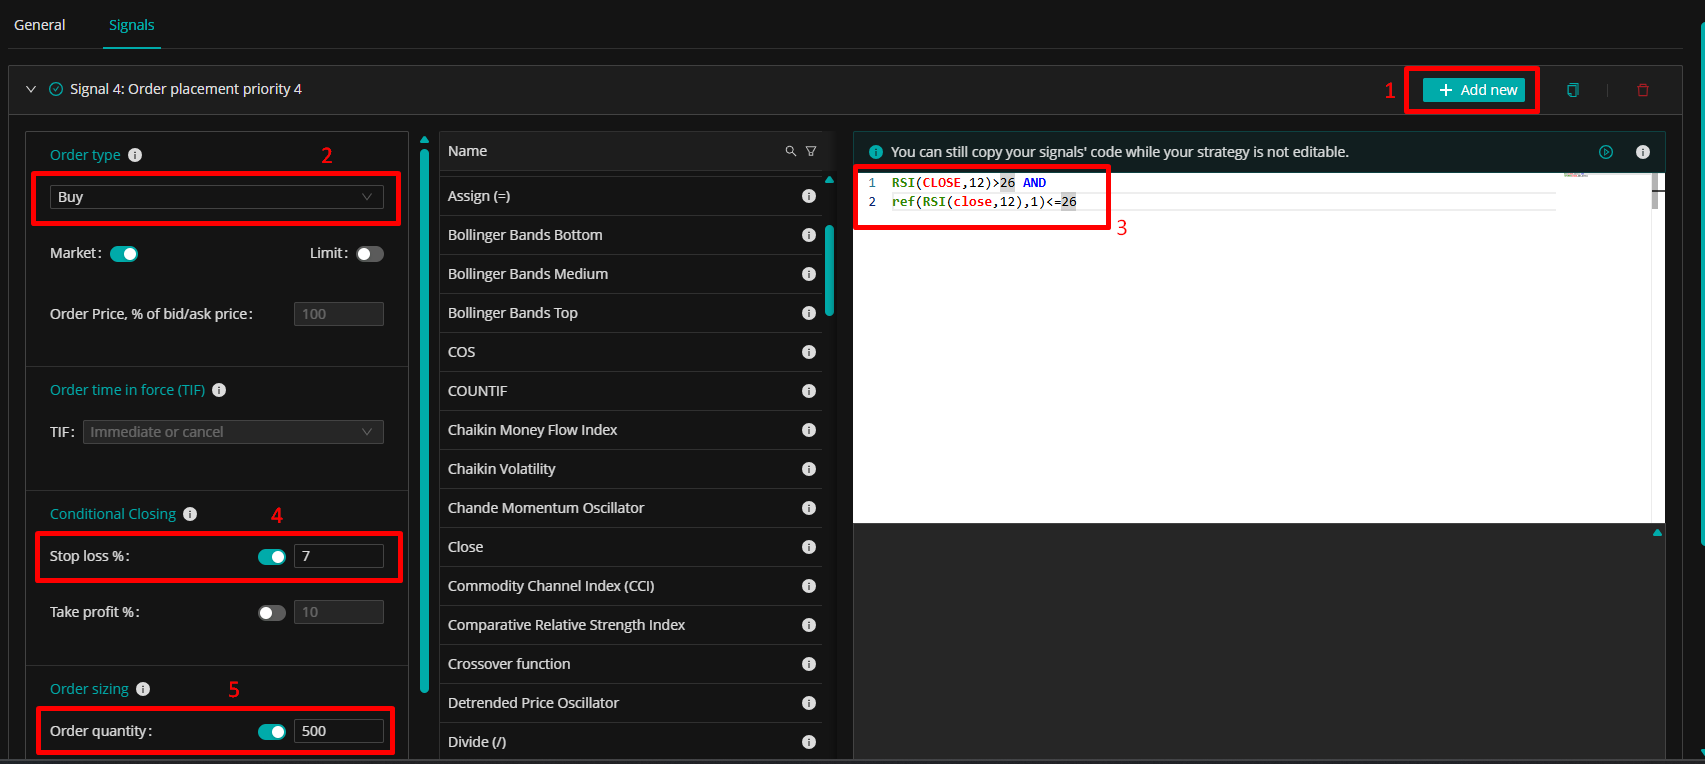
In the Tradescript editor, paste the following formula:RSI(CLOSE,12)>26 AND ref(RSI(close,12),1)<=26
Explanation: ref(RSI(close,12),1)<=26 means the RSI on the previous candle was at or below level 26. RSI(CLOSE,12)>26 means the current RSI is above 26.
Set the field Order Quantity to 500
This condition will close any open short position every time the RSI rises above 26.
Here’s how to create the BUY signal:
Click on Add new
In the Order type field, select BUY
In the Tradescript editor, paste the following formula: RSI(CLOSE,12)>26 AND ref(RSI(close,12),1)<=26
Note: this signal is identical to the Exit Short, since the purchase must occur as soon as any open short position is closed.
Set a 7% Stop Loss
Set the order quantity to 500
This condition will generate a BUY order for 500 shares every time the RSI rises above 26 (covered by a Stop Loss 7% under the current price).
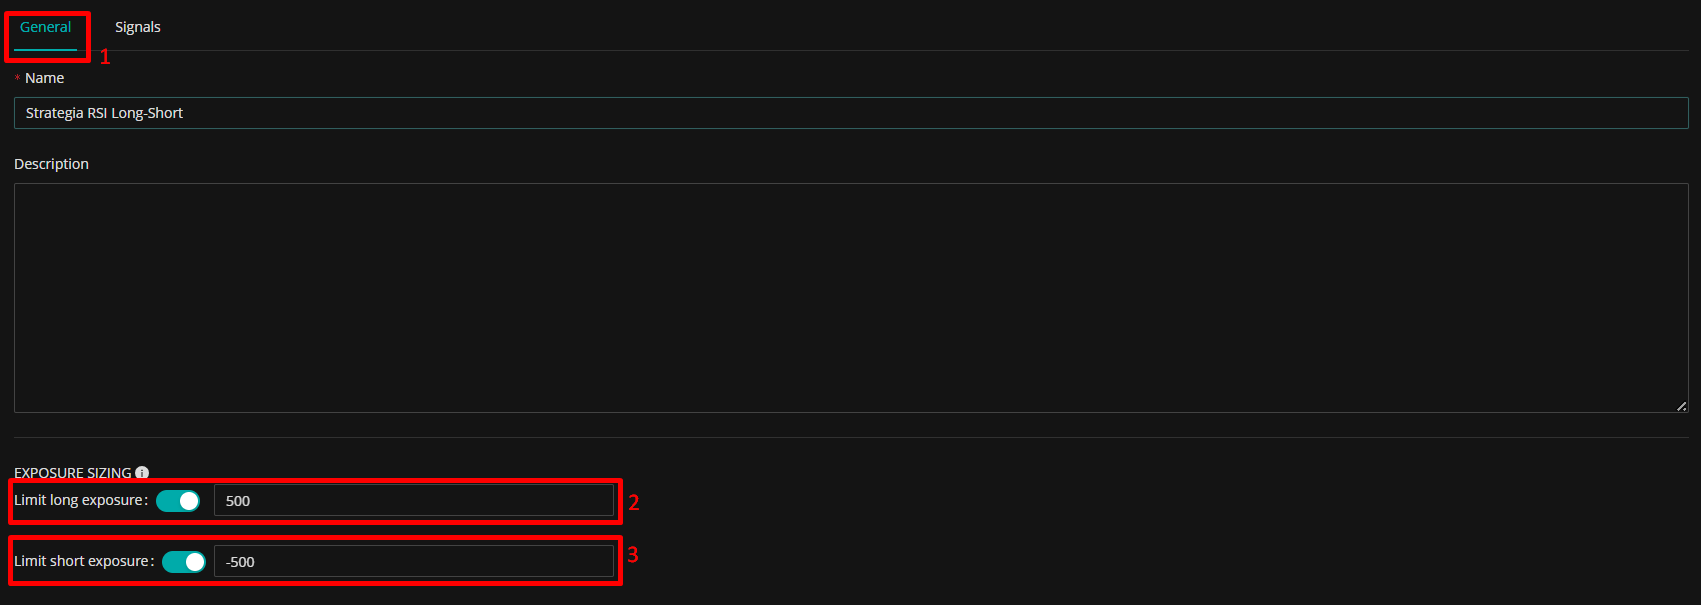
Last but not least, you may want to set a limit to the maximum long and short exposure that your strategy will be allowed to open. We can set these limits in the tab General of the strategy creator, as shown in the image below. In this example, we have set the limit for the long exposure to 500 and the limit for the short exposure to -500, equal to the order sizes for buy and sell orders.
Simplicity: The RSI is a relatively simple indicator to interpret, making it suitable even for those without advanced technical knowledge. It can be easily added to any chart, and its signals—such as the 30/70 thresholds or the crossover of the 50 level—are immediately recognizable and easy to grasp.
Versatility: RSI works on virtually any market (stocks, forex, cryptocurrencies) and across different time horizons, from short to long term. By measuring the strength and weakness of momentum, it helps traders understand how far a trend may extend or when a reversal might be approaching.
Accessibility: Being one of the most popular indicators, RSI is available on practically all trading platforms and is widely known among traders. This means many participants take it into account, which in some cases contributes to the validity of its signals (a sort of self-fulfilling prophecy effect).
Flexibility: RSI can be used alone as the main component of a strategy or in combination with other indicators for confirmation. It pairs well with moving averages, Bollinger Bands, MACD, and other oscillators—enhancing analysis without adding excessive complexity.
False Signals in Strongly Trending Markets: In the presence of very strong trends or high volatility, the RSI can remain in overbought or oversold territory for an extended period and lose effectiveness. In these extreme situations, the indicator may generate misleading signals, prompting traders to enter against the trend too early and potentially resulting in losses.
Does Not Quantify the Magnitude of the Move: RSI signals that momentum is slowing or reversing, but it does not indicate how long or how strongly the price will move in the opposite direction. For example, a low RSI value could precede a small, temporary bounce or a more significant recovery, but the indicator itself does not allow you to distinguish between the two. Therefore, RSI is useful for entry timing, but trade management requires additional tools, such as support and resistance analysis, to estimate potential price targets.
Should Be Used with Additional Confirmation: Relying solely on RSI can be risky. Like many indicators, RSI should be interpreted in the context of the broader market and ideally combined with other forms of analysis—such as price patterns or additional indicators—to increase the likelihood of successful signals. In essence, RSI is an excellent supporting indicator, but it should not be the sole foundation for a trading decision.
In summary, RSI strategies offer traders valuable tools for identifying market momentum and potential reversals. Thanks to their simplicity and adaptability, these strategies can be employed effectively across different markets and timeframes, benefiting both beginners and experienced traders.
However, it's crucial to recognize RSI’s limitations, such as the risk of false signals and its inability to quantify move magnitude. For optimal results, RSI should be combined with additional analysis methods and sound risk management practices. Overall, RSI remains an essential, structured approach to trading, provided its signals are interpreted thoughtfully and contextually.